
Summarize the points from this blog post with AI


The Credit Union “Shopping Cart” Problem
When someone starts a loan application, that’s a strong signal of intent. They’ve chosen your credit union enough to take the first step, but many of them never finish the process. That drop-off moment (starting an application but not completing) is the credit union equivalent of cart abandonment in e-commerce.
Application completion rate (also known as conversion rate) is the percentage of people who start an application and complete it. In our opinion, it’s one of the most overlooked performance metrics for a credit union. Because for each percentage point improvement you can make on this metric, you’ll see more applications and lower cost per acquisition. Conversely, for every percentage point decrease you have in completion rate, the more expensive it becomes for each new applicant.
This begs the question: what is a normal application completion rate? Since this data isn’t published, we decided to do our own research. As a digital marketing agency working with over 70 credit unions, we have visibility to lots of performance marketing data, including loan application tracking. While these metrics aren’t always available out-of-the-box, we’ve come up with methods to capture starts and completions, enabling us to compile data from several dozen applications.
For this post, we’re focusing on data compiled across dozens of installs of the same LOS. But the insights here apply broadly. No matter which LOS you use, the completion rates and patterns we see are a reliable benchmark for how consumers react to online loan applications in general.
And to be clear: abandonment isn’t just a specific software issue. What most credit unions see in their completion rates is really the downstream result of configuration choices: which version they’re using, how many steps are required, how early documentation is requested, how disclosures are presented, and how funding is handled at the end.
Two credit unions can use the exact same LOS and produce completely different conversion outcomes based solely on these UX and implementation choices. That’s why this metric matters. It’s one of the clearest signals of whether your digital lending experience is working as well as it should.
What Are Typical Completion Rates for Online Loan Applications?
Across dozens of credit unions, we see significant differences in completion rates by product type. Some categories naturally perform better than others.
- Auto Loans: 28% completion rate (72% abandonment rate)
- Personal Loans: 42% completion rate (58% abandonment rate)
- Credit Cards: 34% completion rate (66% abandonment rate)
- Deposits: 42% completion rate (58% abandonment rate)
Why App Completion Rates Differ For The Same Product?
Completion rates will naturally be different for different products. But variability in completion rates can exist for the same products at different credit unions. This is because not every loan application is the same, and differences in appearance, requirements, and more can greatly affect the application completion rate.
Here are some of the common reasons we see applications perform differently across our base of credit union clients:
- Document Requirements
Some credit unions require a driver’s license or passport up front, while others allow applicants to upload later. The stricter the requirement at the beginning, the higher the drop-off. - Step and Field Design
Long, dense steps with 20+ fields create fatigue. Breaking them into shorter, more focused steps consistently improves completion rates. - Disclosure Experience
Some implementations require opening multiple pop-up windows and individually acknowledging each disclosure. That extra friction drives abandonment. - Funding Requirements
In deposit and membership applications, the funding step is often the biggest drop-off point, especially when minimum funding isn’t clear until late in the process. - Co-Signer Logic
Attrition increases when co-signers are required. But even worse is poor logic — when the flow shows a co-signer step even if one isn’t needed. Applicants assume they can’t proceed or think they’re doing something wrong. - UX Variation Between Versions
Not all loan app configurations are equal. Older templates and poorly customized versions create more confusion and lower completion rates than newer, optimized versions. - Visual Cues and Click Targets
Styling issues matter. Grey buttons that look disabled, or text that appears clickable but isn’t, create hesitation and second-guessing. - URL Trust Signals
When the application isn’t on a CU-branded subdomain (like app.yourdomain.com), the redirect to a different-looking URL can erode trust and cause applicants to bail. - Data Use Transparency
If it’s unclear how the credit union will use or secure personal data, applicants pause and reconsider whether to submit sensitive information.
You can’t control every factor, but knowing which ones are at play helps pinpoint whether the issue is your application experience or the funnel leading to it.
What Can Credit Unions Actually Control?
Most credit unions don’t own their loan application platform. Your LOS of choice (maybe it’s not your choice, but it’s what you’re stuck with) defines much of the user experience, and that experience may or may not be exactly what the credit union wants or thinks is optimal for their members.
If your completion rate is below average and your marketing funnel is already solid, that might be the signal to evaluate the platform itself. The best-performing credit unions in our data don’t necessarily always have the lowest rates. Instead, they often have the simplest, cleanest application experiences.
Still, there are practical ways to improve results even within the limits of a third-party platform.
How Can Credit Unions Recover Abandoned Applications?
One of the most effective tactics we’ve implemented for our credit unions is what we call a Step 0 form.
This is a short form that sits just before the application. It captures the applicant’s name and email before redirecting them to the full application.
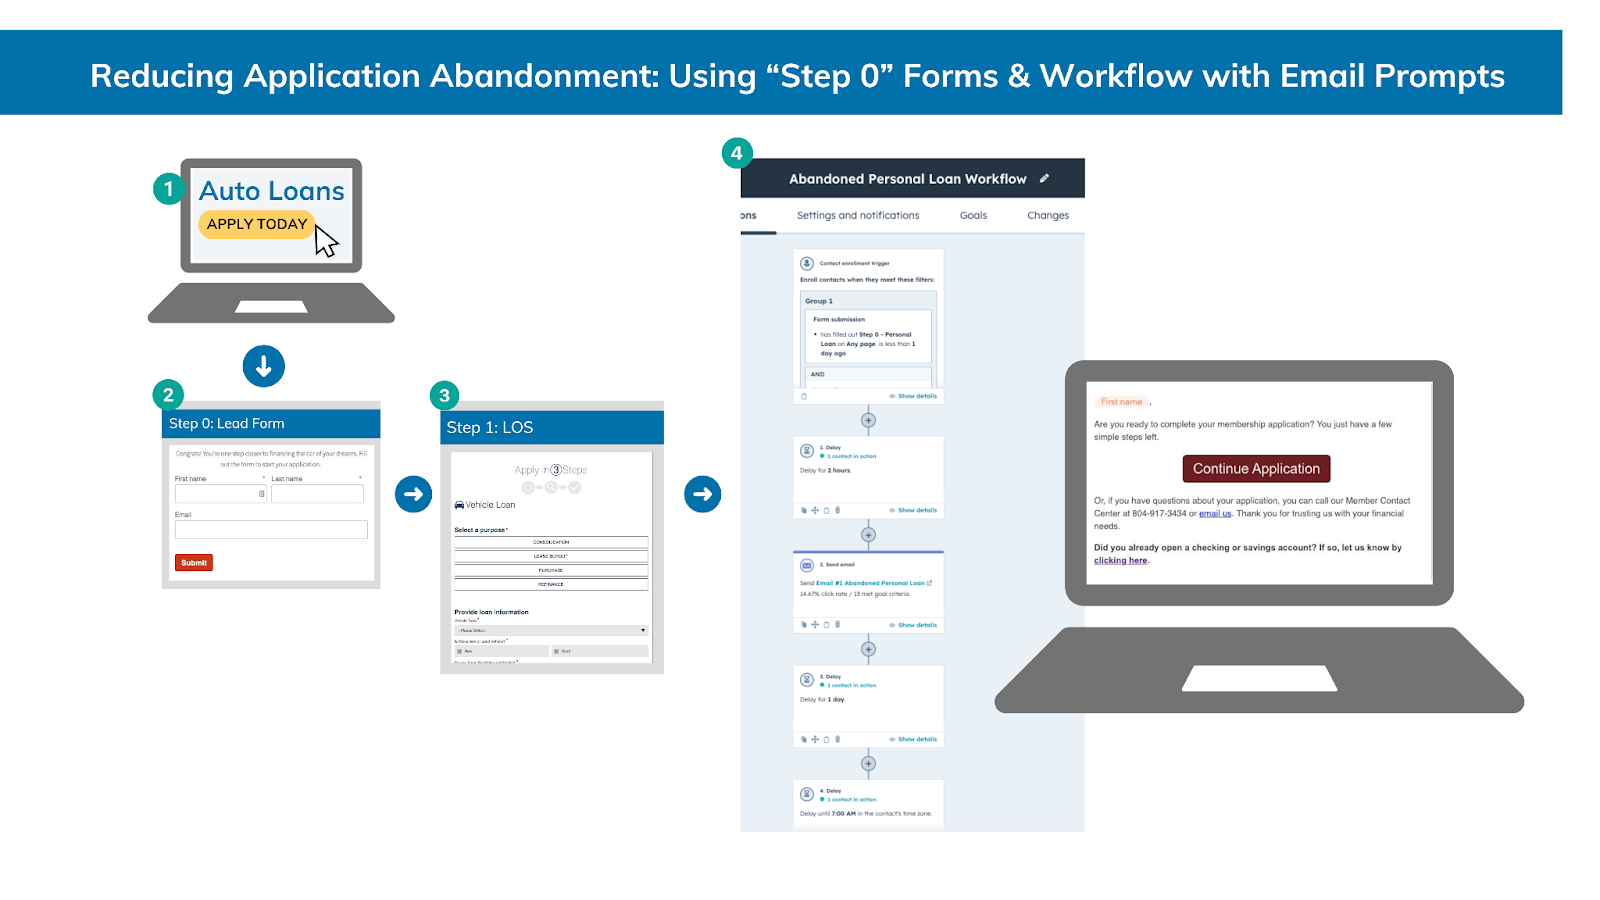
That small step creates a big advantage. You can identify who started, who finished, and who dropped off. For those who don’t complete, we use HubSpot to enroll them in an automated email series encouraging them to come back and finish.
For some credit unions, this simple workflow has recovered up to 35% of abandoned applications. To put that in more specific terms, let’s say 1,000 people begin your auto loan application. Using our benchmark 28% loan application completion rate, those 1,000 “starts” resulted in 280 auto loan applications (meaning 720 people abandoned the application somewhere in the process). If we can recover 35% of those 720 abandoned apps, we’ll bring in an additional 252 applications, nearly doubling the original amount.
Side note: this is why those “did you leave this in your shopping cart” emails are so popular. They work and they greatly improve performance.
What Should Credit Unions Do Next?
Loan application abandonment isn’t just a software issue. It’s a conversion issue, a member experience issue, and sometimes a strategy issue.
When credit unions treat it as a key performance metric, just like a retailer would with cart abandonment, they get a clearer view of how marketing and experience align.
At Geear, we’ve been able to benchmark and improve these metrics because we see what’s happening across dozens of credit unions, hundreds of campaigns, and thousands of applications.
If you want to understand your own loan completion rates and find ways to improve them, we can help.

Special thanks to our talented team member, Layne Runyon, who compiled the data used in this report.

Ready for marketing that actually delivers?
Let's build something measurable together.
 Talk to the Team